The Whole of Australian Government (WoAG) Travel Arrangements (the Arrangements) provide over 160 government entities access to a range of travel services, including air travel, accommodation and car hire. The Arrangements deliver a range of savings by aggregating the Australian Government’s buying power to obtain discounted pricing, decrease administrative costs through the removal of procurement duplication, and simplify processes by integrating technology, unifying pricing and aligning systems. International accommodation and vehicle rental bookings are optional under the Arrangements.
The data below provides an overview of air travel, accommodation and car rental booked through the Australian Government’s travel management provider. Please note that government travel significantly reduced over 2020-21 and 2021-22 due to the COVID-19 pandemic.
Travel Expenditure
Between 1 July 2025 and 31 March 2026, government air travel, accommodation, and car hire services had a combined expenditure of $639 million (GST inclusive).
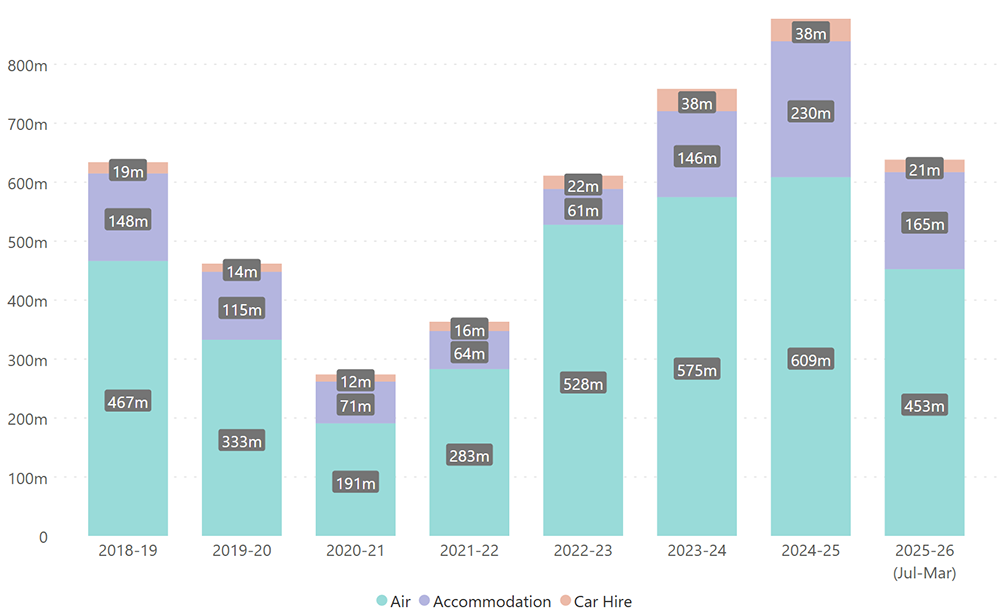
Figures for Travel Expenditures graph above can be found on the Travel arrangements tables page.
* Expenditure does not include Travel Management Services arrangement fees.
Travel Bookings
In 2025-26 (July-March), approximately 783,000 bookings were made through the Arrangements across air travel, accommodation, and car hire.
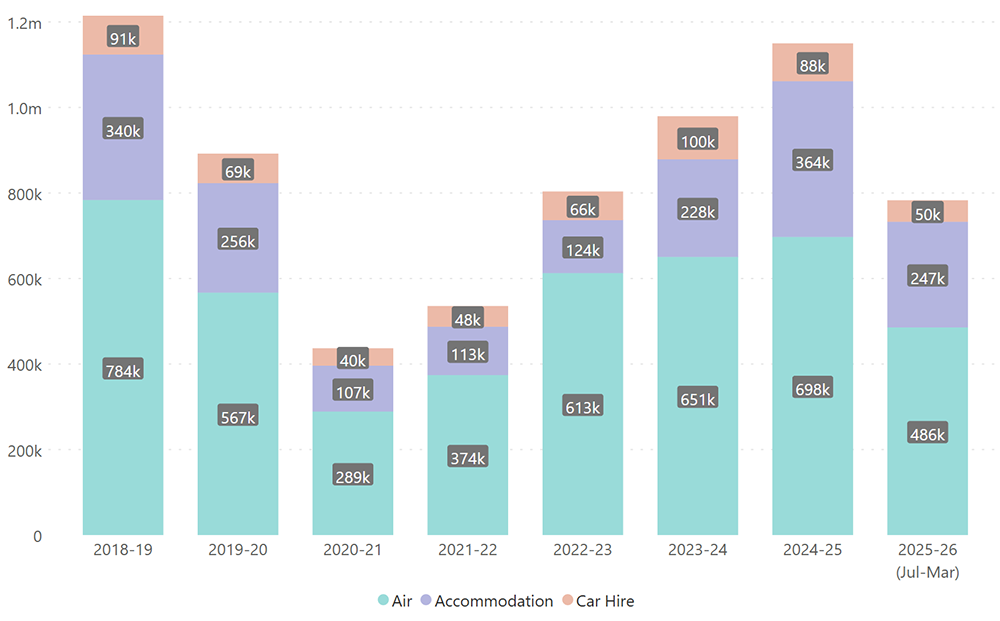
Figures for Travel Bookings graph above can be found on the Travel arrangements tables page.
City Pairs
A city pair refers to air travel between a city of origin and an end destination city, whether the journey is direct or involves one or more connecting flights.
City pair figures shown on this page are bidirectional, meaning travel in either direction between the origin and destination cities are considered a single city pair. Return air travel between two cities are counted twice – once for each direction – in these statistics.
Air travel bookings that include travel to more than one destination are excluded from city pair statistics; this represents approximately 5 per cent of bookings.
Top 10 Domestic City Pairs by Expenditure
Between 1 July 2025 and 31 March 2026, total domestic air travel was $281 million (GST inclusive), representing 62 per cent of total air travel expenditure. The top 10 domestic city pairs accounted for 45 per cent of domestic air travel expenditure.
| City Pair | Expenditure | Travel Volume |
|---|---|---|
| Canberra-Melbourne | $23.1m | 69,891 |
| Canberra-Brisbane | $19.0m | 48,735 |
| Canberra-Sydney | $15.7m | 52,636 |
| Canberra-Adelaide | $13.6m | 29,120 |
| Canberra-Perth | $13.2m | 14,890 |
| Sydney- Melbourne | $11.2m | 42,757 |
| Sydney-Perth | $8.4m | 13,891 |
| Sydney-Brisbane | $7.2m | 27,331 |
| Melbourne-Brisbane | $7.1m | 22,493 |
| Melbourne-Darwin | $6.6m | 8,236 |
Domestic City Pair Airline Market Share
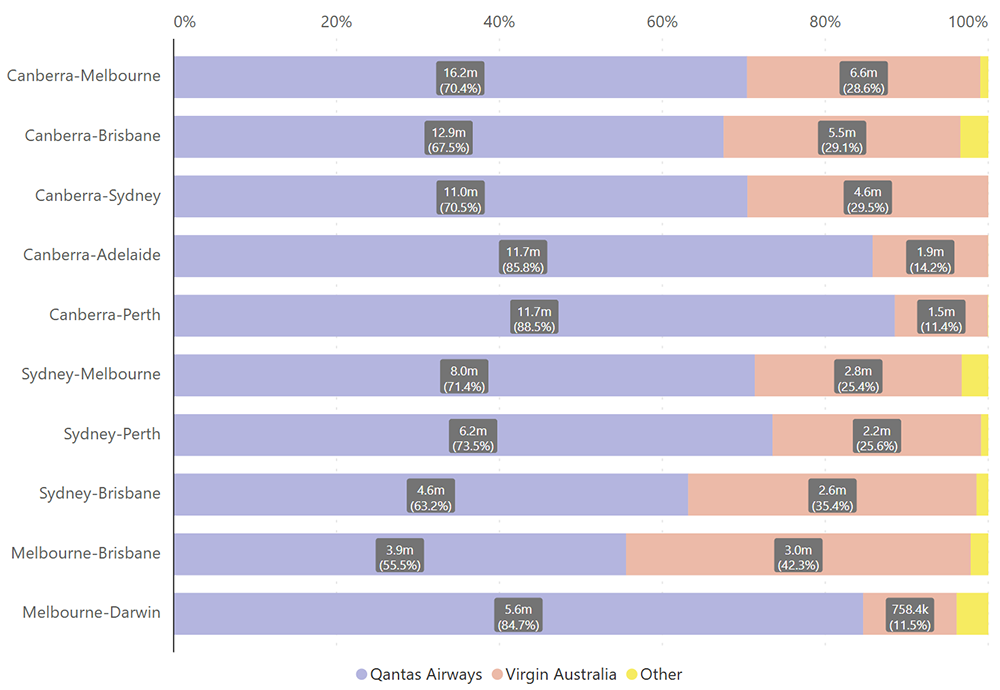
Figures for Domestic City Pair Airline Market Share graph above can be found on the Travel arrangements tables page.
Airlines representing less than 5 per cent of expenditure for the individual city pair are grouped as 'Other'.
Top 10 International City Pairs by Expenditure
Between 1 July 2025 and 31 March 2026, total international air travel was $172 million (GST inclusive), representing 38 per cent of total air travel expenditure. The top 10 international city pairs accounted for 19 per cent of international air travel expenditure.
Despite having a high travel volume, some city pairs within the Asia-Pacific region do not appear in the top 10 by expenditure due to the lower cost of travelling within the region.
| City Pair | Expenditure | Travel Volume |
|---|---|---|
| Canberra-Washington | $8.4m | 1,458 |
| Canberra-London | $7.2m | 1,355 |
| Canberra-Ottawa | $2.5m | 372 |
| Canberra-Tokyo | $2.3m | 650 |
| Sydney-London | $2.2m | 633 |
| Canberra-Jakarta | $2.0m | 833 |
| Canberra-Paris | $1.9m | 363 |
| Melbourne-London | $1.8m | 470 |
| Canberra-Geneva | $1.8m | 307 |
| Canberra-Honolulu | $1.7m | 652 |
International City Pair Airline Market Share
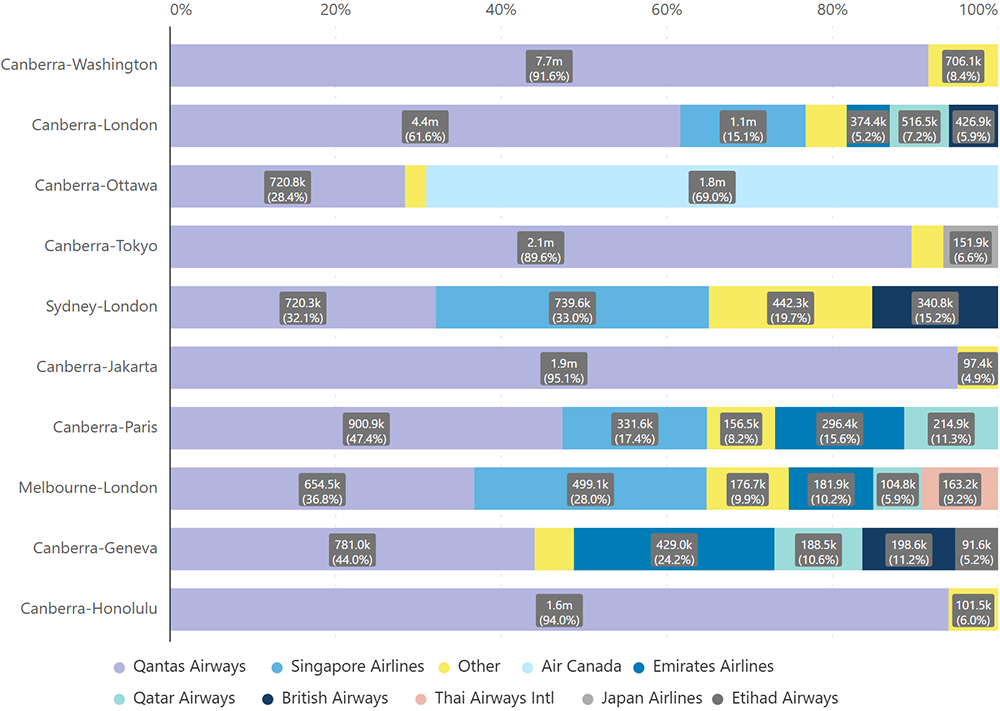
Figures for International City Pair Airline Market Share graph above can be found on the Travel arrangements tables page.
Airlines representing less than 5 per cent of expenditure for the individual city pair are grouped as 'Other'.
